Check Your Basketball Team's Winning Probability
SIMULATING THE 2022 NBA PLAYOFFS
Background
We used average in-games statistics for the 2021-22 NBA regular season up until 3/26 to simulate the 2022 NBA Playoffs. Seeding was based on current NBA standings (3/26). Data Wrangling was performed in R and Python. Modeling was performed in R. Regular season matchup statistics were used to predict the winner of each playoff series with our model. The simulation was performed in Python. Winners of a series were determined by the team who had the highest average predicted points per game vs. their specific opponent.

SIMULATING THE 2022 NBA PLAYOFFS
Model
A multiple linear regression model was built using Points as a response variable and other significant in-game statistics as predictor variables.
Akaike Information Criterion was used in the model building.
Points Scored = -41.638194 - 0.021608(Total Min. Played) + 0.444643(FG Attempts) + 61.370820(FG %) + 1.528445(3P made) + 8.676025(3P %) + 0.906622(2P made) - 0.151111(2P Attempts) + 0.772466(FT Attempts) + 22.768362(FT %) - 0.619125(ORB) - 0.661647(DRB) + 0.628026(TRB) + 0.015954(AST) - 0.026812(TOV) - 0.025056(PF) + 0.426828(FG made)
Key:
FG = Field goal, 3P = 3-point shot, 2P = 2-point shot, FT = Free throws, ORB = offensive rebounds, DRB = defensive rebounds, TRB = total rebounds, AST = assists, TOV = turnovers, PF = personal fouls

CONFERENCE PREDICTIONS
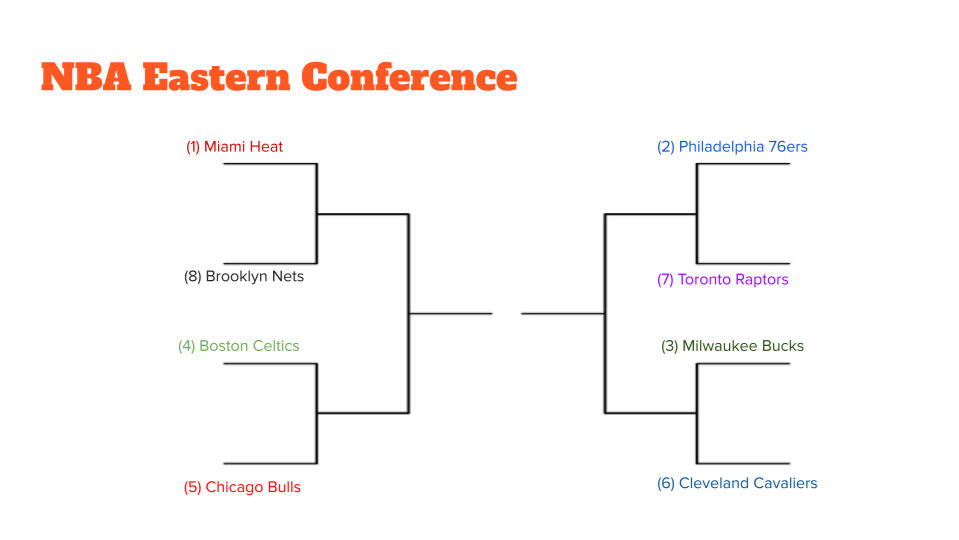
Click on the Team Brackets to continue to the Final Four
CONFERENCE PREDICTIONS
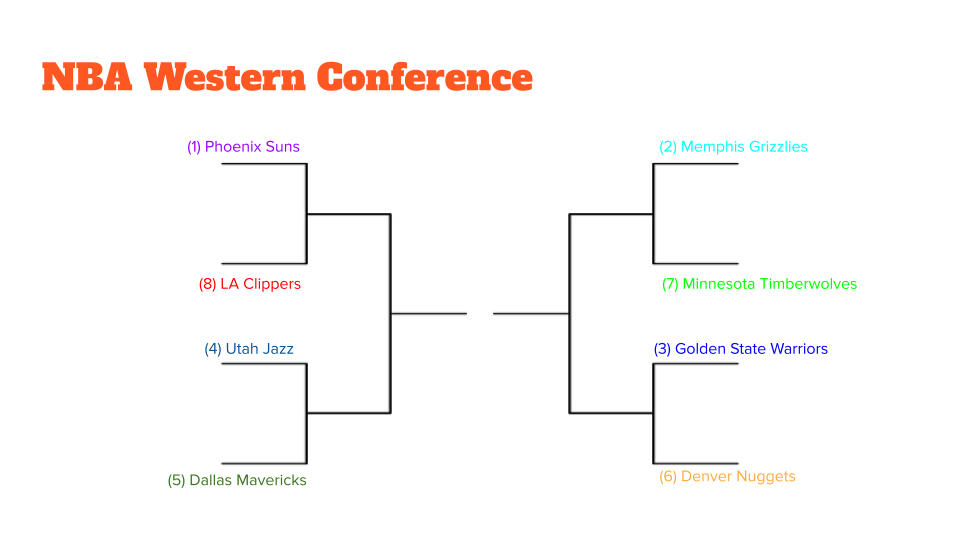
Click on the Team Brackets to continue to the Final Four
FINAL FOUR
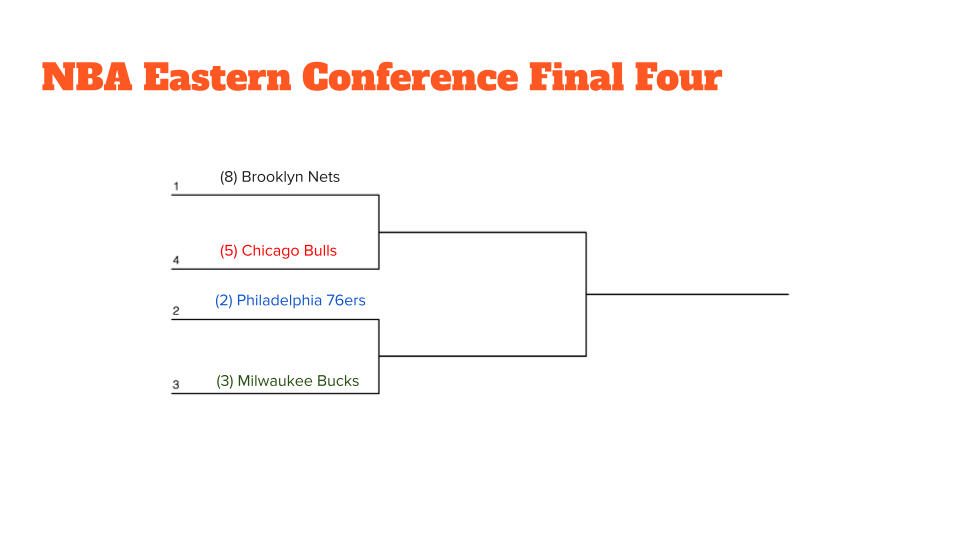
Click on the Team Brackets to continue to the Conference Finals
FINAL FOUR

Click on the Team Brackets to continue to the Conference Finals